
Credit: Flippable.org.
How two progressive organizations, Tactical 2017 and Flippable, use open-source data and strategic voting, and why that might dictate the future of our elections.
Politics are reactive, and with many governments across the globe currently holding conservatives in the majority, those on the left are looking for a political upset. In the UK, the Labour party has witnessed a rocky rise under Jeremy Corbyn. In the U.S., the minority Democratic Party is looking to reclaim Congress in the 2018 midterms. If the last two years of political discourse have taught us anything it’s that, no matter what end of the spectrum voters are on, they aren’t looking for the same old faces to serve their interests. New methods of voter engagement are emerging and they involve tactics with which designers might well be familiar.
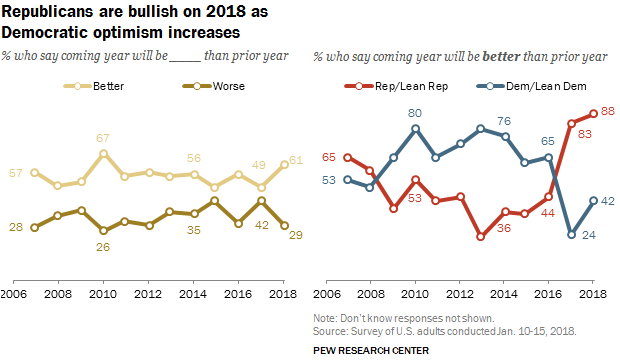
Typical to the ebb and flow of a two-party system, the minority has momentum on their side. A recent poll by the Pew Research Center indicates that liberal Democrats are especially excited by the midterms this year, and progressive organizations outside the official arms of party campaigning are looking to leverage that enthusiasm to get the Dems back in office. From a design perspective, what’s particularly interesting about some of these groups is their new applications of data to inform voters about the best way to exercise their rights. Many of them support the notion of voting strategically, based on a candidate’s odds of winning, and initial results in the UK seem to demonstrate a strong direct impact on voting behavior at the polls.
You might expect the intelligent application of data to be a bedrock of campaign strategy (ever heard of polls?), but a selection of these new upstarts are turning the process on its head. Tactical 2017 in the UK and Flippable in the U.S. have taken to pushing data sets out to the voting public directly, urging them to use this information to make more strategic use of their vote. Sure, you can vote with your heart, but wouldn’t it be better to vote with your head? These guys sure think so.
You can vote with your heart, but wouldn’t it be better to vote with your head?
There is of course, an ocean between the political landscapes of the UK and the U.S., although both are structured around the first-past-the-post system, and the process of strategic voting—essentially, giving the user research to the user—is equally applicable to both.
A measure of success: Tactical
Tactical 2017 was the brainchild of Becky Snowden, a social media manager and marketing executive for a furniture retailer in the north of England frustrated by the first-past-the-post voting system she feels typically favors the Conservatives. In April 2017, incumbent Prime Minister Theresa May called a snap election (an election called earlier than required by either law or convention) in an attempt to increase her majority in the House of Commons and further secure her mandate to deliver a ‘hard Brexit.’ Snowden was spurred to action—her mission simple; to find a way to oust May’s Conservative party and begin the process of electoral reform. “If it stopped Brexit too,” she says, “that was just the icing on the cake.”
Unlike the U.S., the UK is a multi-party system, with 12 different political bodies holding seats in the Commons since the 2015 election. Preventing the Conservatives from consolidating a majority meant uniting a wide range of voters from across the political spectrum. Snowden did this in the simplest way she knew how; by tweeting a simple spreadsheet of potential swing seats for use by the public.
“The way that our voting system works means you end up with certain seats having only one or two potential outcomes, but the parties could be quite different,” says Snowden. “I made a spreadsheet that showed when there was a two-horse race between the Conservatives and their closest rival, so you’d know that if you wanted to get rid of the Conservatives then you should vote for the other party.”
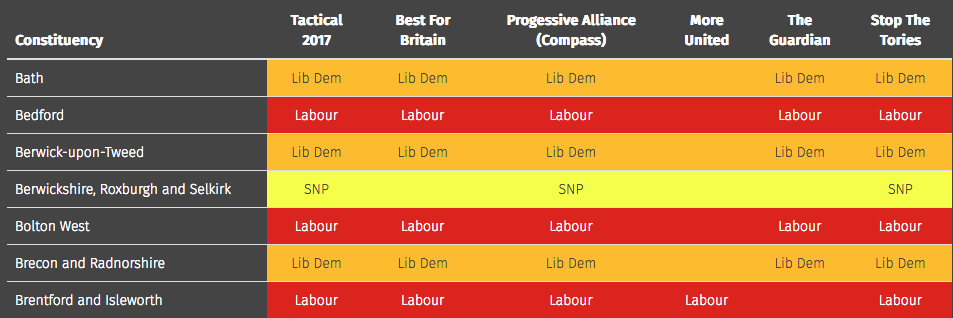
A sample of key seats by constituency as outlined by Tactical 2017.
To ascertain which parties were most likely to topple the Tories (Conservatives), Snowden manually combed through data from the previous two election cycles, revealing the voting patterns of constituents in every single seat. “I went through all of the different seats personally—I think 650 in total. It took a long time, but all the information was freely available online. It was just a case of pulling it all together. Looking at the past results, some were easy to call and some were obvious safe seats. Others were a lot harder to predict, and we didn't actually fill in every seat immediately.”
After releasing her initial spreadsheet, Snowden was contacted repeatedly by a number of volunteer campaigners offering assistance and Tactical 2017 transformed from a one-woman show to a small movement with political clout. A dedicated website with supporting social channels was launched and Tactical 2017 became a hub for progressive voters across the country. The site isn’t necessarily pretty, but it engaged design principles in strategy rather than aesthetic. Pretty wasn’t the point. Pretty doesn’t always pan out.
Did it work? Well, Theresa May and her Conservative government are still in power, although that power was greatly reduced after 2017’s snap election. May maintained her premiership not by increasing her party’s majority, but via a negotiation to create an informal coalition government with the Democratic Unionist Party (DUP). The data suggests that this was in no small part thanks to Snowden and the efforts of Tactical 2017, and a handful of other tactical voting platforms.
As far as the UK’s Electoral Reform Society is concerned, the poll and voting data suggest a sea change in how members of the public vote. “Despite Labour and the Conservatives gaining over 80% (82.4%) of the vote share between them, a look under the surface shows this was no return of two-party politics,” they say. “Our research suggests that voters did not flock back to the two largest parties with enthusiasm. Millions of voters planned to vote tactically this election, with 20% saying they would be choosing the candidate that was most likely to beat the one they disliked. This is over double the proportion who said they would do so in 2015. Projecting this onto actual turnout would equate to nearly 6,500,000 people voting tactically.”
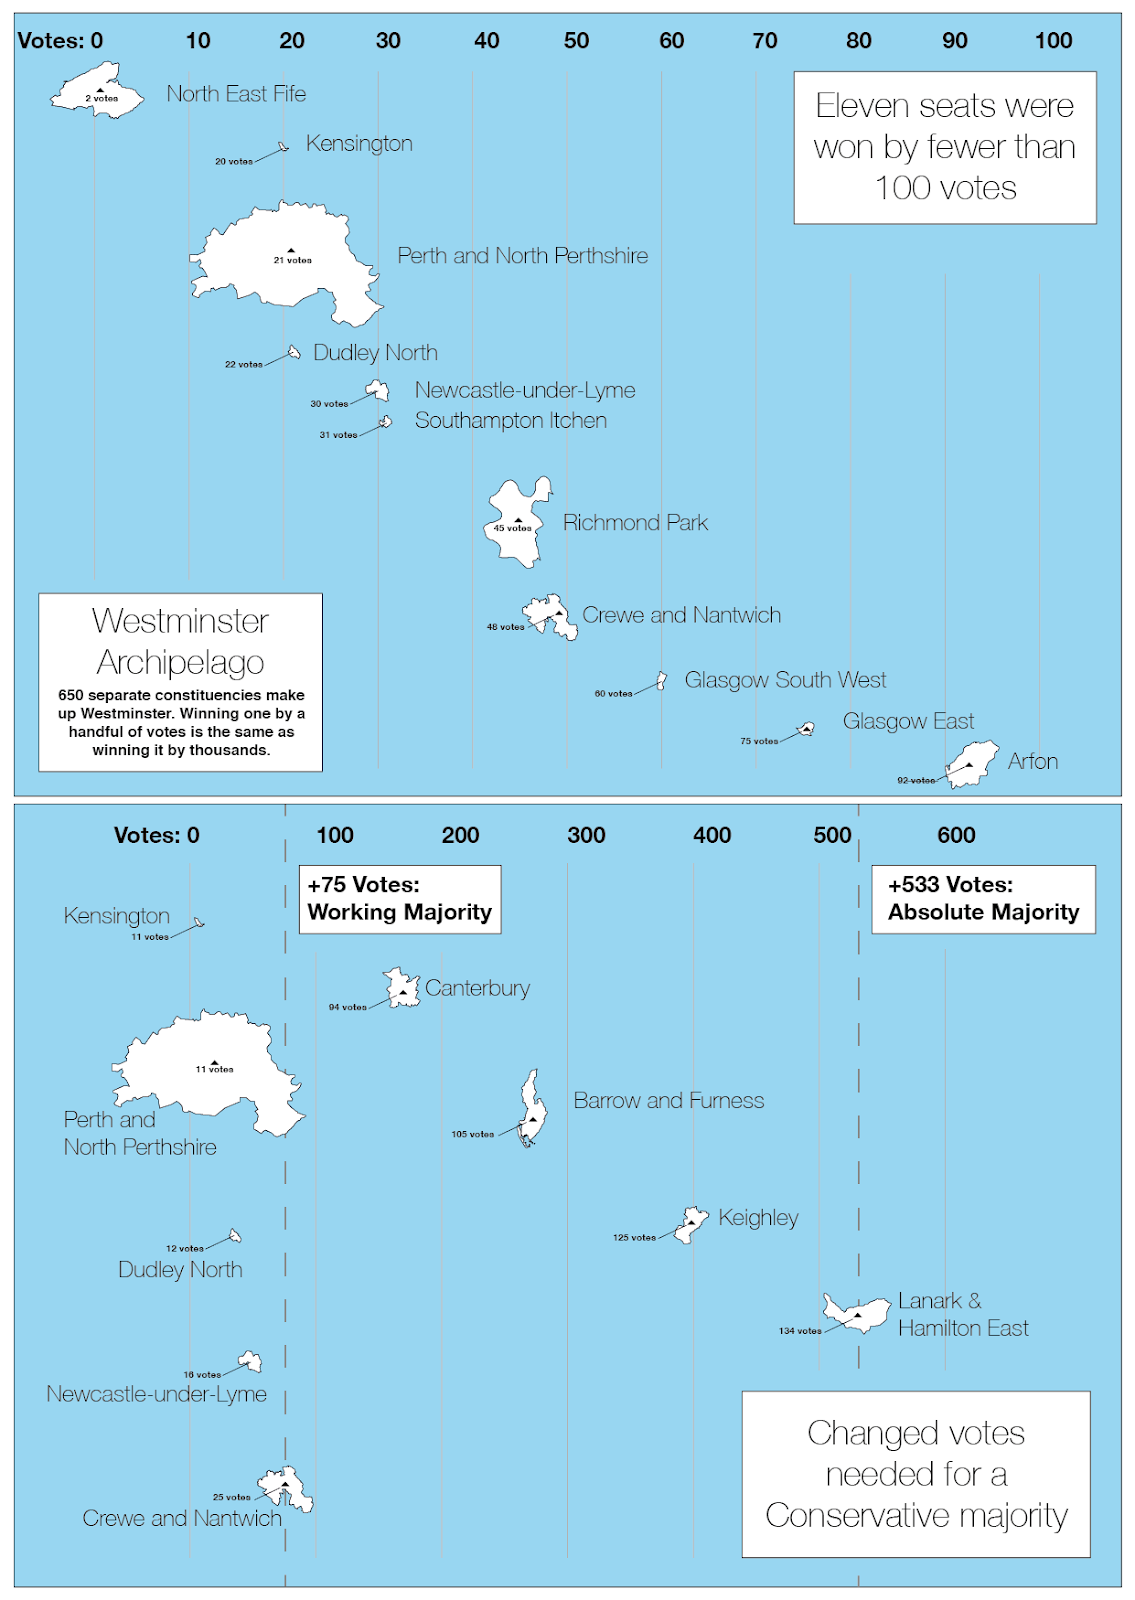
Above: Constituencies won by fewer than 100 votes in the UK’s ‘Westminster Archipelago’ the 650 individual constituencies that comprise the members of the House of Commons. Below: Changed votes needed for a conservative majority. Credit: UK Electoral Reform Society.
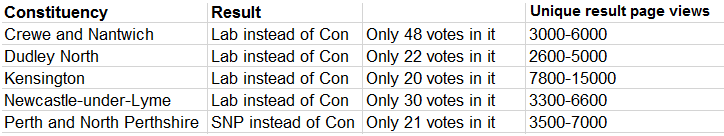
Other analysis demonstrates a more specific link with Tactical’s provision of data and results in individual constituencies. Some seats were ceded by the Conservatives with a margin smaller that 50 votes, and these same seats received upwards of 2,000 pageviews on Tactical2017.com in advance of the general election. What this demonstrates, says Snowden, “is that in Kensington, for example, between 7800-15000 people used Tactical 2017.com to see the recommendation for that seat, which was Labour, and Labour won by 20 votes. We are quite confident that if those 7,800+ people hadn't visited our site, then Labour wouldn't have won that seat.”
Snowden doesn’t claim to be solely responsible for the Conservatives losing their majority (a young and engaged body of young voters reportedly boosted Labour’s performance) but she’s confident that their work had a direct impact on the result.
Raw data used by Tactical 2017 founder Becky Snowden. Credit: Becky Snowden, Tactical 2017.
“A lot of people were fed up with politics and politicians in general, and they didn't really trust any of the parties. To just see some normal people put something together, I think they trusted that a little more. It’s happening on both sides of the Atlantic, because I think you could argue that's one of the reasons that Trump got elected; people thought ‘Ah, he's not just your average politician.’ They wanted something different, and rightly or wrongly they thought they could trust him because he's not a politician.”
“A lot of people were fed up with politics and politicians in general, and they didn't really trust any of the parties. To just see some normal people put something together, I think they trusted that a little more.”
A new testing ground: Flippable
Tactical’s most obvious counterpart on the other side of the pond is an organization called Flippable, formed the day after the 2016 U.S. presidential election. Although similarly staffed by a lean team (of seven), they’re a little slicker than Tactical (they didn’t have to race to keep up with a snap election): a carefully designed site with original illustrations provides a breakdown of their strategy, goals, and results to date; robust editorial content so their audience can “get smart” about government; diverse video content, and the capacity to accept donations that go direct to the Dems. They’ve got more cash behind them, too.
Credit: Flippable.org.
Flippable’s staff background in politics varies. Co-founders Catherine Vaughan and Chris Walsh have experience in marketing, consulting, and campaigning, and met on Hillary Clinton’s campaign in 2016. The rest of the team have worked in design roles for Girl Develop It, the Clinton campaign’s donations team and McKinsey to name a few. Safe to say that design and its related fields are well represented. It looks like that representation is only expanding; they’re currently hiring for digital specialist, research and digital content intern, data fellow, data visualization intern, and a web engineer.
In the United States, state elections can have national implications because state legislatures draw voting districts, set state voting laws, and more. Flippable is starting from the bottom up, narrowing its focus to the state level of government to flip state seats from Republican to Democrat. The ultimate goal, says Vaughan, is “to provide our users—the progressive community—with tools to better vote for fair democracy.” The organization is looking beyond midterms, with a four-year plan to flip as many seats from red to blue as possible before 2020, when new district lines are drawn for Congress. How exactly does Flippable assess when a district has the potential to flip parties? Like Tactical, it’s all about the data. Vaughan outlines their three-step process:
- Chamber prioritization. Determine which chambers fall into the category of “flippable” to change policy dynamics in that state, but also nationally—in particular, impact on national elections. The relative weight of policy priorities (such as fighting voter suppression) are discussed at the leadership level to figure out which states it’d be most strategic to focus on.
- Forecasting. After bringing in data analysts to look at previous trends and historical voting margins, the team decides whether to get involved in an upcoming race by looking at the projected margin, the number of votes it would take, and the cost to flip a district. No two states have the same number of seats, so it’s not possible to create a set number of seats that’d make a state flippable.
- Review ethical standards and programs. Any politician seeking support of Flippable takes a survey. If they correspond with Flippable’s progressive values, then they move forward.
Essentially, Flippable uses regression analysis, combining quantitative data sets pulled from the Daily Kos’ database of state legislative returns among other sources, with qualitative discussion. This determines which races have a likely margin of success, and therefore which candidates the group should endorse and support with donations, and which races voters should focus on.
The ultimate goal, says Vaughan, is “to provide our users—the progressive community—with tools to better vote for fair democracy.”
The Flippable site claims that by contributing to their organization, “You’ll advance a powerful, data-driven movement that’s already seen results.” According to Flippable.org, they've helped elect 16 Democrats since launch in 2016. Flippable has set a goal to flip 100 in 2018, but unlike Tactical, we’ll have to wait until 2020 to analyze their impact.
“We look at a few different measures of impact: Whether we're accurately predicting flippable seats; how much money we raise and volunteers we mobilize to flip those seats; and our ability to create sustainable behavior change in our users—like mobilizing first-time donations to state candidates, signing up volunteers, and generating ongoing engagement with civic education content,” says Vaughan. “Everyone talks about a blue wave. Does it belong to anyone? From an engagement and attribution level, it’d be hard to say, ‘it was us.’”
Part of their impact measurement has to do with their site performance. For the design team specifically, this means refining KPIs around website and email engagement: conversation rates, donations, and increasing the time spent on page. In a nutshell, they want to drive as much traffic to Flippable as possible, using views as a metric of overall awareness of state races.
“There are other organizations working on turnout. Our tactic has been to educate people civically and to grab low-hanging fruit—people who raised their hand because they care about progressive politics—and use them as evangelists. We trust our candidates to inspire their communitites and drive turnout. Our job is to support them with the resources they need—donations, volunteers, and amplification—to reach voters in their communities.” Flippable defines success broadly, and that allows them leeway (perhaps, some ambiguity) in determining a win rate.

Illustrated blog post featuring candidates endorsed by Flippable. Credit: Flippable.org.
The breakdown
In the digital design and AI spaces, we talk a lot about the increasing necessity of data as part of mechanized decision-making processes. There are hazards to relying heavily on quantitative data in predicting outcomes and in guiding political action. As seen with Tactical, these hypotheses impact political strategy and voter behavior. But quantitative data alone may not paint a full picture. There are pitfalls in relying more heavily on data to predict outcomes.
“The data that we’re using is at the district-level,” says Vaughan, “Not Cambridge Analytica-level individual voter analysis. There are limits to trying to typecast people and target them according the to the pieces of data you have available. At the state legislative level, you want to be smart about how you target people. That personal connection can be really important. I know a lot of people who have run for office and have a newfound appreciation for meeting voters face to face rather than through data analysis and targeted digital messaging.”
Tactical and Flippable are extending the analytical upshot beyond internal campaign teams and to the general voting public, providing everyone the tools to be strategic when they cast their vote. But will the tactic currently being tested by progressive organizations, with momentum on their side, continue to work? Will it spread across the political spectrum?
These days, in making a President, data is king.
One could argue that it already has. In breaking down how they secured a Republican majority during the 2014 midterms, the GOP said the National Republican Congressional Committee (NRCC) “made a full-scale commitment to data”; while the Republican National Committee used new apps for door-to-door canvassing and up-to-the-minute metrics that allowed for more nuanced voter targeting, listing “modernize[d] digital, data, and turnout operations to be competitive” as one of five key steps to success.
That was four years ago. In 2016, Donald Trump secured Brad Parscale as his digital director, and has since promoted him to campaign manager in 2020. These days, in making a President, data is king.